“How many people are involved in your ministry?” Have you ever seen someone stammer through this answer and give four or five different numbers?
Here’s the messy answer that I often gave: “Well we have ______ that come to our weekly meeting, _______involved in bible studies, ______etc,”
It’s crucial to quantify your ministry so that you can accurately discern how well you are doing at drawing and connecting new people, and developing and empowering leaders. If people start fitting into more than one of your metrics than you cannot accurately diagnose and strategically make changes. From there it’s easy to start relying on your gut which may or may not be accurate (hint: it’s not. see this post on why no one listens to data).
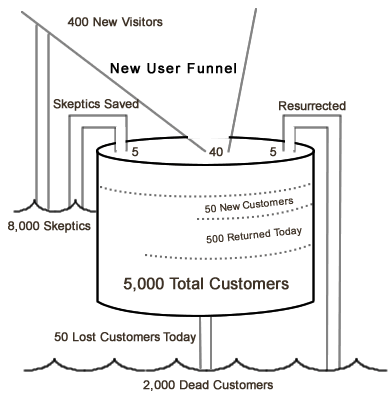
Here’s a great diagram from this blog post that provides an alternative or complementary way of looking at your ministry:
New Customers
Returned Customers
Skeptics
Dead Customers
I really like the distinction between skeptics and dead customers. Here’s how the designer of the funnel describes a skeptic:
“This is someone who tried your product in the past but never became a customer; now they’ve come back and converted.”
So often when evaluating my ministry we treated skeptics like returned customers. This often caused problems when talking about leadership development because our numbers were bloated by skeptics, and our actual pool of potential leaders was lower than reported.
Same problem with dead customers. In college ministry these are usually juniors and seniors that still attend ministry events but purely for social reasons, but are not aligned to the mission, vision and values. Again these dead customers were counted as returned customers, which bloated the total size of our ministry.
Anyone else have trouble accurately counting your ministry? Any insights or links to share that would be helpful?

